2022 Best of the Midwest: Startup Cities Rankings
A top-3 shakeup, a growing unicorn herd and more capital than ever before
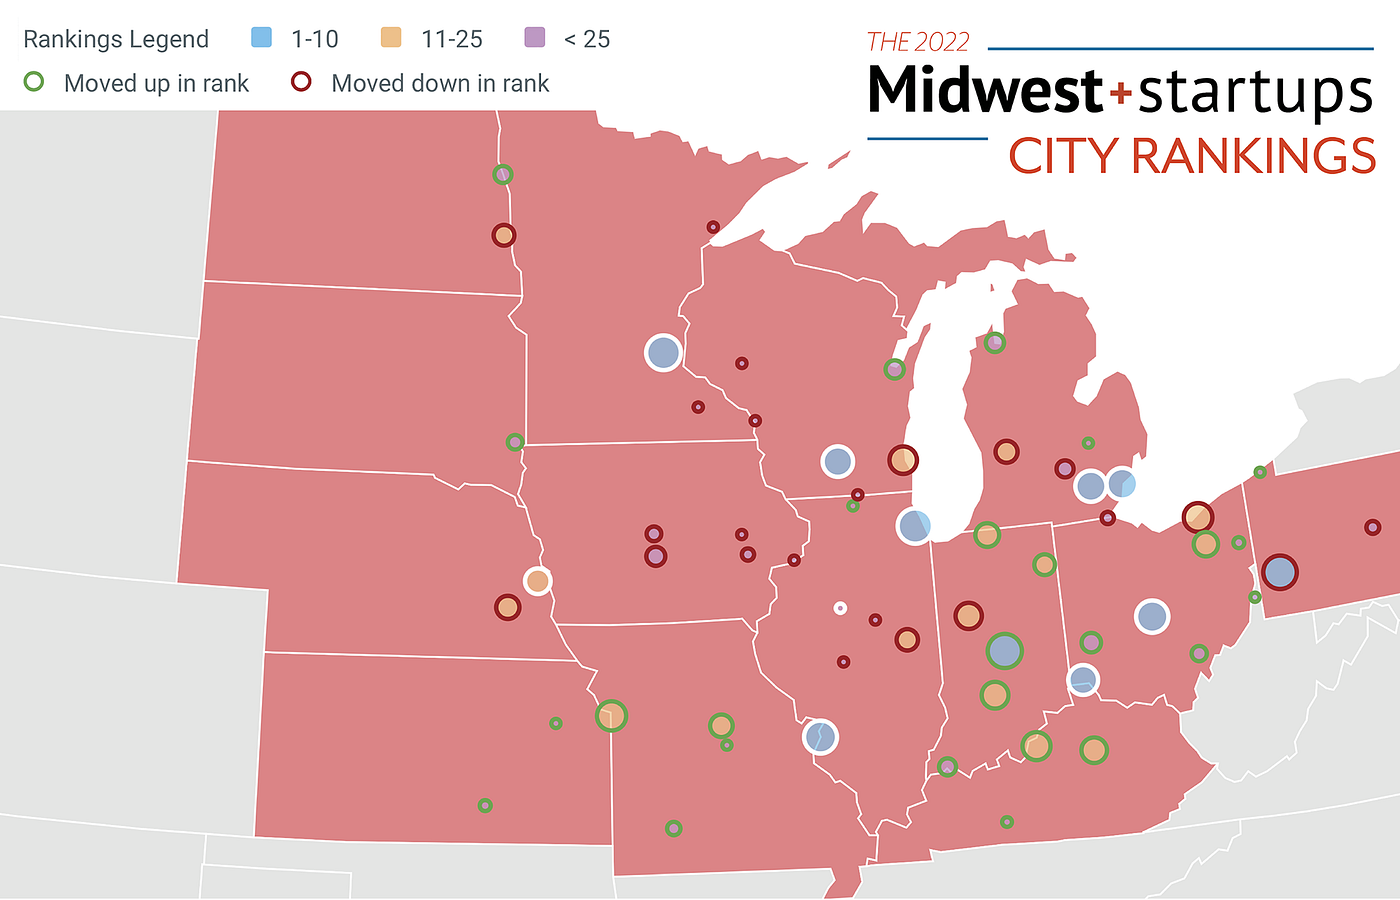
The annual Midwest Cities Rankings are our yearly deep dive into understanding how micro-environments in the Midwest are performing relative to one another in terms of startup activity, access to resources, and business climate. To view the full rankings, visit the city rankings page on Midwest Startups.
The story this year is not a simple story to tell. Coming off a blistering 2020–21 year, that momentum continued through the second half of 2021 — and then seemed to abruptly stop. From the public markets on down to growth stage to Series A and even seed, activity has slowed down tremendously in 2022. Even though record amounts of venture capital have been raised, much of it appears to be on the sidelines as both the late-stage and IPO markets have cooled down — and with it a recent dearth of major acquisitions. Call it a recession or just a correction, but the environment is clearly NOT what it was this time last year.

That somewhat gloomy outlook may not be all that bad for the Midwest. The Midwest has been poised and ready for this. When you look at the large and growing list of painful layoffs at large tech companies, very few of them are HQ’d in the Midwest — and while it will be very hard to collect data on this as they are rarely announced or publicized, the Midwest will not face the surge of crushing valuation resets and down-rounds that coastal peers do. Why? It’s a combination of factors, but it comes down to what we do well — building high-growth yet sustainable tech companies, often targeted in long-term ‘backbone’ of the American economy industries and selling real, value-add products to non-VC-backed customers. Few Midwest startups raised on 100x+ revenue multiples with a poor economic model and inefficient spend. Instead, these startups largely raised and spent more modestly while achieving impressive growth, which will suit them well as the market resets.
With that out of the way, we are still here to celebrate and gauge the success and growth of the Midwest’s startup communities large and small. A LOT of major events took place over the last twelve months. Maybe the most notable is the number of VC firms with $300M+ funds announced: Baird’s Fund 2, Jump’s Fund 7, Energize’s Fund 2, Vensana’s Fund 2, Builders’ Fund 1 and — the elephant in the room — $1B across multiple funds for Drive Capital. In prior years, the region would only announce one $300M+ fund if we were lucky, and this year we count six— and that’s not including another half-dozen that raised $100M-$300M (granted — most of these funds are concentrated with headquarters in Chicago but do invest across the region and/or nationally). This also matches and confirms the narrative that there is dry powder out there, even in the Midwest, although it may be more slowly deployed in the coming years.
Additionally, we saw a new unicorn herd come of age: Cincinnati never had a unicorn before this year — and went on to announce three with major raises from Astronomer ($213M Series C by Insight), 80 Acres Farms and Enable Injections. Chicago announced 12 new unicorns for the 2021 calendar year and Columbus added another with Branch Insurance. And the money started flowing back to founders, investors and team members too — before things completely dried up, we saw M&A and IPOs/SPACs — St. Louis with high-value SPACs for Varsity Tutors and Benson Hill, a near half billion exit for Cincinnati’s VNDLY and Chicago’s Fast Radius SPAC’d for $1.4B.
All of this action made for some interesting observations when it came down to the rankings — in some ways there was surprising stability but across the board we saw dramatic movement and upsets. Most noteworthy — a top three shakeup (which has never happened since these started in 2017) and a complete lack of stability in rankings 11–25 (including a nine-point surge and a two five-point surges). Remember — these rankings are relative, where each city is competing against the other to have the most compelling ecosystem. So even if a particular ecosystem is doing well, if it isn’t doing great then it may in fact lose ground. This can be frustrating from a rankings perspective, but the overall scores tell more of a story — for example, last year #11 Cincinnati trailed #10 Madison by 2.0 points. That lead has since narrowed to just 0.7 points. We’ll get into more of that later, but before any additional spoilers leak please allow us to introduce your 2022 Best of the Midwest: Startup Cities Rankings!
Some quick takeaways:
Indy to #3
The headliner here is that for the first time since the rankings began, the Chicago-Minneapolis-Pittsburgh ‘natural order’ has been displaced by the Hoosier state capital. This gap has been narrowing for years — Indy overtook St. Louis for the #4 slot in 2019, up from the #8 starting position in 2017. And it has clearly been a combination of factors — while Indy still has fewer absolute startups by number, it has very strong momentum and exit stats along with edges in employee loyalty, accelerators, labor costs and cost of living. But the biggest single factor is the government programs score — Indiana has gone aggressively into launching and maintaining all three types of startup resources (well-funded direct startup investing, a competitive angel tax credit and a large fund-of-funds program). This is paying dividends with more and more startups getting funded at all stages, which increases ‘shots on goal’ for the city to produce the next ExactTarget-like outcome. Perhaps most encouraging are when you see journeys like Encamp, which recently announced a Series C; Encamp (founded by Indiana University grad Luke Jacobs) went through local accelerator gBeta, received early investment from local investors IU Ventures, Allos and High Alpha as well as Indy-based angel investors for multiple early rounds. It then grew with Boston-based Openview before receiving further growth capital down I-70 from Columbus-based Drive Capital (the largest VC firm in the region). That story has several pieces of what startup communities can do, both the obvious (hosting a local accelerator) and the non-obvious (High Alpha and Allos are both recipients of capital from the state fund-of-funds program).
KCMO on its way up
The next noticeable movement would be #11 Kansas City displacing #12 Cleveland — something not too surprising for those with a pulse on these ecosystems. While Cleveland does continue to grow, Kansas City has started to consistently produce large success stories — the sign of a mature ecosystem and a trait that could get them to the top ten in the coming years. The most encouraging growth points last year were multiple large “coastal” Series A rounds — the $24M Series A for TripleBlind (led by General Catalyst) and the $15M Series A for Kinly (led by Forerunner). The size and caliber of these financing events at this stage would have been unheard of just a few years ago in KC, and the seeds have been sown for the next generation of Backlot-, PayIt- and C2FO-type outcomes.
Chicago’s momentum
Chicago has been at the top and is not stepping down. Last year we mentioned Chicago’s host of new unicorns (they ended 2021 with a total of 12 newly minted unicorns for the calendar year) but the most compelling stat to watch is Chicago’s startup momentum score. Underlying that score is a 5-year growth rate of 40% for the number of Chicago startups — an increase of 343 since 2017. That’s 343 more chances at another Fast Radius, M1 Finance, Copado or Nature’s Fynd (to name a few of last year’s new unicorns). This repeat success is breeding more success and at a bigger scale than ever before, and it will be hard for other cities to even keep pace, let alone displace the region’s #1.
Kentucky on the map
Kentucky saw gains for both #13 Louisville (+1) and #17T Lexington (+9!) marking best-ever performances for both cities and putting Louisville above Milwaukee for the first time ever. Louisville really shines on business climate (#8 overall) and both cities do well with Employee Loyalty and Exits compared to their peers. And even #43 Bowling Green moves up 3 spots this year 👀👀👀
The Classic Rivalries:
Michigan vs. Ohio
Last year Ohio pulled off a close win and this year was also a nailbiter. While #7 Detroit and #8 Ann Arbor held firm, #23 Grand Rapids dropped one spot — but rising micropolitan community #29 Traverse City offset some of that loss by gaining 3 spots. Michigan was also one of the first 5 states to get their SSBCI money approved, showing clear initiative to get more resources flowing to their startups. Major funding activity was less rigorous in the mittens than in previous years though: Ann Arbor held its own with $118M for Insight-backed Workit Health and a handful of other inspiring stories including $35M Series B for Duo Security mafia spinout Censys. On the other side of Lake Erie, Ohio had #6 Columbus and #10 Cincinnati holding their ground while #12 Cleveland dropped a spot. Interestingly, #19 Akron (+5), #27 Dayton (+4) and #34 Athens (+14) all saw strong positive momentum to bring Ohio’s depth chart into play. But what this ultimately comes down to: Ohio saw four unicorns minted (Branch Insurance in Columbus and Astronomer, Enable Injections and 80 Acres in Cincinnati) with massive rounds accompanying each (plus a ~$500M acquisition of VNDLY). All considered, I have to give it to the Buckeye State for a back-to-back win.
The 3 C’s of Ohio
Continuing on Ohio rivalries, we look at the battle for top C-city in the state. Columbus is still definitely taking the cake, but the score difference of #6 Columbus (23.1) to #10 Cincinnati (19.7) is shrinking: it was 4.0 last year and now lowered to 3.4. Give Cincinnati another year or two for their fresh crop of unicorns to exit and they might start to really compete. The opposite is to be said for #12 Cleveland — last year they were a 0.1 difference to Cincinnati but this year that lead grew to 1.6 and they fell below #11 Kansas City dropping to twelfth. This is the biggest spread on these three cities (#6 to #12) since they started and if the trend continues we may have to discuss soccer-style relegation…
Collegetowns
While it may be hard for any ecosystem to grow as fast as the Big Ten adds schools, this year saw a lot of growth for collegetowns — refreshing to many given the concerns with how COVID and virtual schooling would impact these smaller ecosystems. First up is the same story as last year for #8 Ann Arbor edging out #9 Madison — with the point gap widening from 0.3 last year to 0.8 this year. Ann Arbor retains a huge lead in Startup Density and overall Business Climate, and as mentioned above is still putting out major funding rounds and well-backed Duo Security-spinoffs. Madison did have another massive $240M round for Fetch Rewards and has a thin lead on absolute number of startups, but it’s going to need another hit (or two) to narrow the gap.
The next crop of rivalries was more dynamic — #15 Bloomington, IN edged out their Boilermaker rivals #16 Lafayette for the first time ever (by a margin of 0.2 points) and #17T Lexington rose nine spots to put the Wildcats in the mix. Btown’s success was driven by a huge boost in Startup Momentum, signaling to rivals that there will be more startups and subsequent success stories in the future.
After that we saw a close battle between a sliding #21 Lincoln (-2) holding off a rapidly-growing #22 Columbia, MO (+5). Columbia won this year’s Midwest Madness and boasts major unicorn EquipmentShare, the Scale Accelerator and a high percentage of local startups getting venture funding.
There is a lot more we could unpack but we encourage you to dive into the rankings and underlying data yourselves. Ultimately these are just one yardstick and we expect more growth (and volatility) in the coming years. Will it inspire the next Ry Walker (cofounder of Cincy’s Astronomer) to build one of their city’s first unicorns? Will there be another billion-dollar VC firm coming to take advantage of the surging opportunity like Drive Capital did in 2014? Or will that longtime developer at Facebook or Google finally return home to Minnetonka, Lincoln, Waukesha or Grand Rapids and join a local startup building a big vision here in the heartland. Who knows — but one thing is sure: it’s a good idea to #InvestintheMidwest
Methodology Recap: How the Rankings were Calculated
Relative vs. Absolute: Before we start to ask ourselves what makes one ecosystem better than another, or one ecosystem moves up or down in the rankings, it is important to understand what we are measuring. These rankings measure a core based statistical area’s (CBSA) relative rank as an ecosystem for a startup to launch, grow and scale. A city can still absolutely improve while its rank stays constant or falls. In fact, due to the strong macroeconomic market for software/digital startups and the rising tide throughout the Midwest region, it is very likely that the vast majority of these ecosystems grew since last year.
Data: We divided it up into three categories with 27 underlying weighted variables that come from 18 different data sources, ranging from the US Census to the HumanPredictions tech talent database to individual state government websites. Since 2018 we have relied solely on PitchBook as our source of startup and investor data. We realize there will be some degree of error from any data source, and there can be healthy debate and judgment on how to weigh the importance of individual variables. Ultimately we aim to be as consistent and objective as possible and understand it will continue to improve every year.
Data and Calculations
Our 27 variables are pooled into 3 major categories (data cutoff date at 06/30/2022). Here is what goes into each one:
Startup Activity which includes subsections for Startups (number, density and momentum), Exits and Big Outcomes (40.5% Weight):
A measure of how active the tech community in the city is, and the size and quality of the network available to a new startup. Factors included are the number of startups present, the number of exits, the growth in startup formation and the scale of large outcomes (both large exits and large fundraises). Data comes directly from Pitchbook.
Access to Resources which include subsections for Talent, Sales & Innovation, Investor Presence, Accelerators/Incubators, and Government (42.5% Weight):
A measure of how supportive the city’s environment is, and the value-add it can provide to help a startup grow. It considers factors such as the quality, quantity and loyalty of the available talent, investor activity, accelerators, universities and government support. Data comes from several different sources: the US Census, US Patent & Trademark Office, HumanPredictions, Fortune.com, Pitchbook, US News & World Report, The Global Accelerator Network, US Small Business Administration and individual state websites.
Business Climate which include subsections for Business Costs, Demographics and Connectivity (17.0% Weight):
A measure of how conducive the city’s economic environment is to attract and scale a business. It includes demographic and economic factors such as the cost of living, labor costs, business tax friendliness, population and GDP per capita, as well as ‘connectivity’ indicators like the quality of internet access, airport and highway infrastructure. Data comes from several sources: the Bureau of Labor Statistics, the Bureau of Economic Analysis, the US Census, the Tax Foundation, the National Digital Inclusion Alliance and Google Flights.
A HUGE shoutout to Sam Cavender and Leandro I Bedolla who meticulously pulled all of the data through several months of tedious work and planning. Additionally thank you to Katie Birge, Ruth B. and Abhinaya Konduru for help in visuals, publishing and distributing.